
Our project is in the field of soil carbon dynamics, specifically looking at the rate of carbon dioxide efflux around Prospect Hill as well as areas that have been manipulated by different abiotic (nitrogen input and temperature) and biotic (adding leaf litter and removing roots) factors.

A preliminary map was generated using GIS to identify areas (polygons) in Prospect Hill with unique stand (prominent tree species) and soil drainage types. A total of 59 areas were identified, but some were excluded due specific conditions (i.e. excessively drained areas like bogs and impervious areas), leaving a total of 56 plots. The biggest polygons have three plots each. For reconnaissance, we used GIS to find the center point of each polygons on, and would place a collar down for the sampling chamber to be rested upon. We also sample at four different treatment areas: trench plots, chronic N, and soil warming (hot plants/warm ants), all located in the Prospect Hill tract, and DIRT (detritus input and removal treatments), which is located in the Tom Swamp tract. At the trench plots, a tarp was placed underneath the area and the roots were removed. At the chronic N plots, we sample six treatments, low nitrogen input, high nitrogen input, and control in both a pine and deciduous stands. The soil warming site has 30 plots with varying temperature changes. There are 21 DIRT plots, some with double leaf litter, others with the O and A soil horizons removed, and other such manipulations. We placed three collars in each DIRT plot and five collars in each chronic N plot. There is one collar in each of the soil warming plots, and three collars in the trenched plots and three collars outside of the trenched plots, which serve as the control.
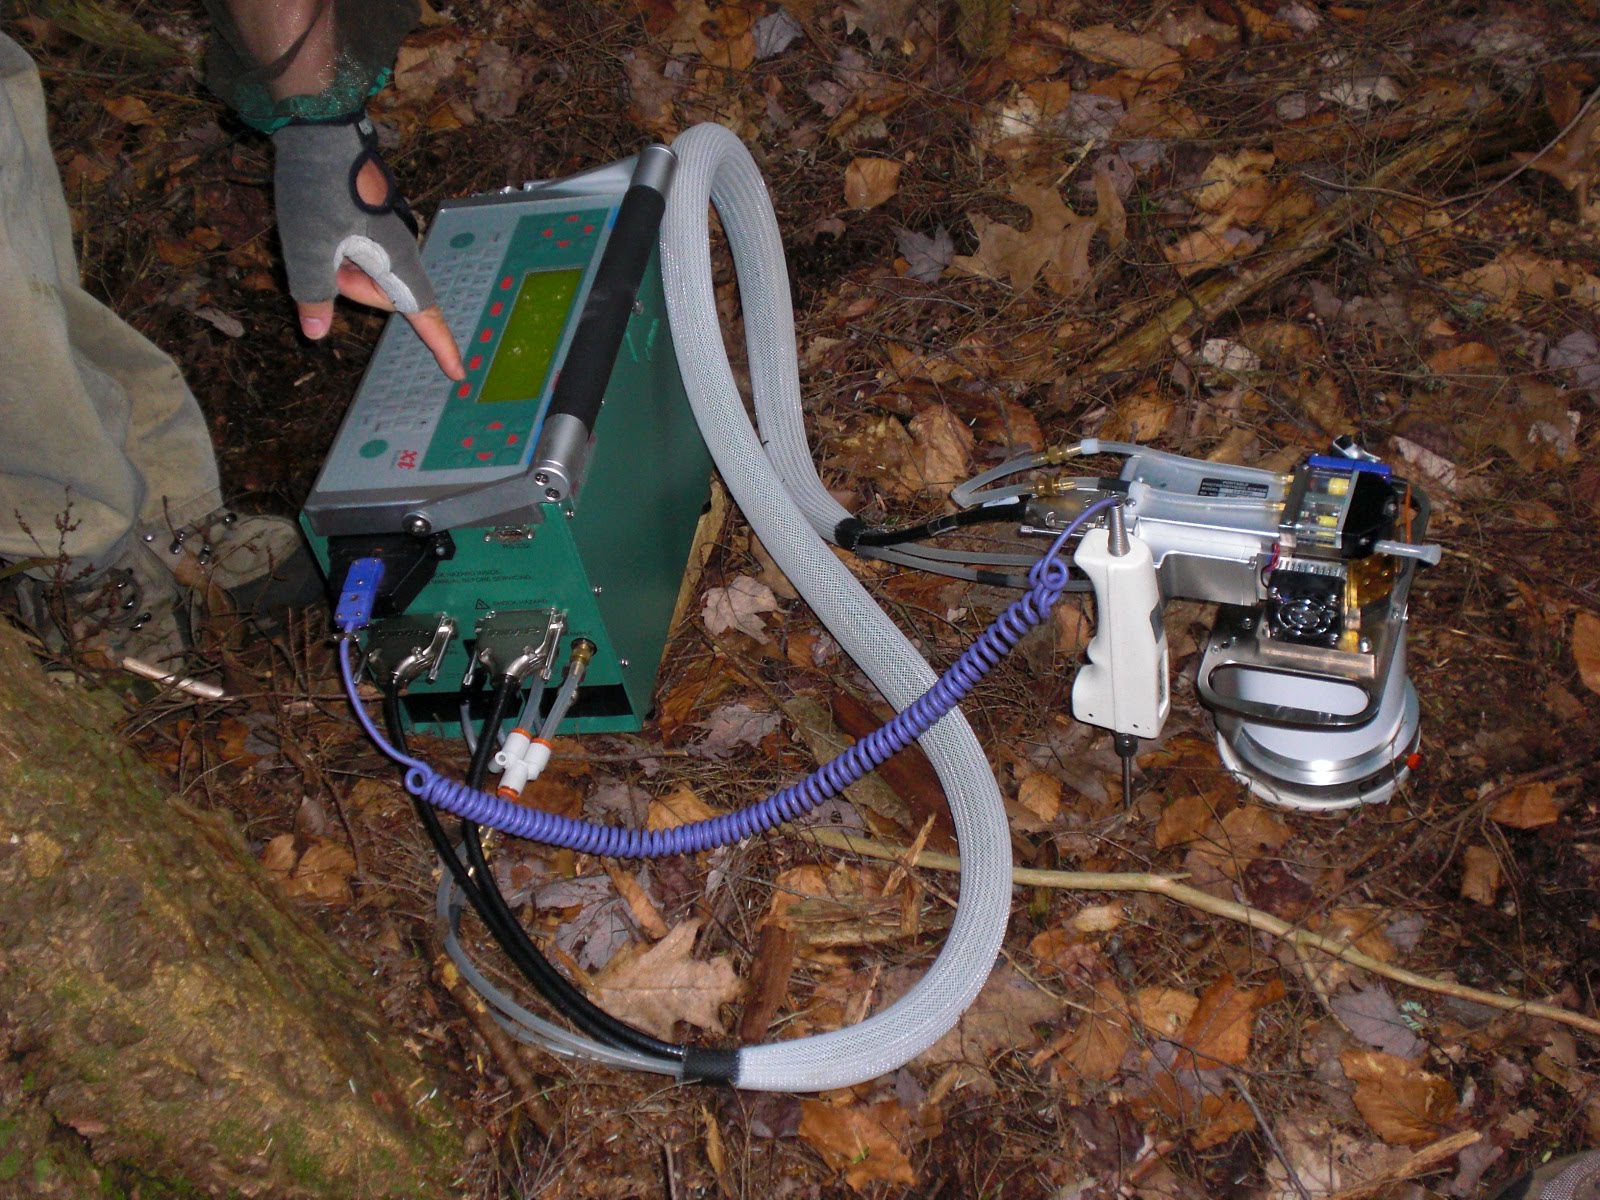
We have divided tasks among our group, with Claudia dealing with gradient (Prospect Hill) efflux trends, Joanna looking at trends among the different treatments, and Maya conducting spatial analysis to look at efflux trends based on location in Prospect Hill. Soil respiration, as well as soil temperature and soil moisture, is measured every week, gradient and treatment locations alternating biweekly (a total of 10 weeks of sampling, 5 weeks of gradient and 5 weeks of treatment). We use the LiCor 6400 photosynthesis analyzer machine to measure soil temperature and soil respiration, and the HydroSense probe to measure soil moisture. Sampling usually takes only 1-3 days out of the week, so the rest of the week we usually work on our individual tasks, organizing data, running statistical tests, and inputting and analyzing data in GIS. Currently, we have augered samples at each of the gradient locations (organic and mineral layers) and are now processing the soils in the lab for root density, bulk density, and carbon and nitrogen content. We also plan on gathering the leaf area index at each of the gradient plots in the last few weeks to see how biomass affects soil respiration.

While we are still gathering and analyzing our data, we have learned many things about forest ecology and how different variables would affect soil respiration. For instance, we have learned that warm and wet conditions would cause an increase in carbon dioxide efflux, and that microbial (decomposition) activity is higher in the morning and also in the trenched areas (since there is significantly less root respiration).
No comments:
Post a Comment