- Sarah (REU '10) at St. Norbert College in Wisconsin
- Lianna with Sofiya and Cory (REU '10) at Mount Holyoke College in Massachusetts
- Andrea (REU '10) at Humboldt State University in California
- Margaurete (REU '10) at Saint Leo University in Florida
- Mickey (REU '10) at Franklin & Marshall College in Pennsylvania
- Angie (REU '10) at Clark University in Massachusetts.
- David, Relena, and Jen (REU '03, '08, and '09) at Harvard and Wellesley Colleges in Massachusetts
Researching, Investigating, Innovating
Monday, November 22, 2010
Spotlight on summer students
Several of our recent REU students were featured in stories written by their home universities this year.
Tuesday, August 17, 2010
'10 REUs Say Goodbye to Harvard Forest, For Now
By Aleta Wiley
After their two-day Symposium and a final day of cleaning, organizing, and packing, the summer students at Harvard Forest had nothing remaining except to say their goodbyes before heading back home. For twelve weeks, the students lived together in two houses at the Forest, sharing stories about their homes and colleges, from Oregon to Texas to Wisconsin to Vermont. Now, it was time for them to disperse and begin telling their friends and family the stories about their summer in Petersham, MA. Thank you all for a fantastic program! Keep in touch, as all of our paths are bound to cross again in the future.

After their two-day Symposium and a final day of cleaning, organizing, and packing, the summer students at Harvard Forest had nothing remaining except to say their goodbyes before heading back home. For twelve weeks, the students lived together in two houses at the Forest, sharing stories about their homes and colleges, from Oregon to Texas to Wisconsin to Vermont. Now, it was time for them to disperse and begin telling their friends and family the stories about their summer in Petersham, MA. Thank you all for a fantastic program! Keep in touch, as all of our paths are bound to cross again in the future.

Friday, August 13, 2010
Student Highlight: A Final Excursion Before the End of Summer
By Sarah Gray
Before tears were shed and goodbyes were said, a few of the REU students went for ice cream at Carter and Stevens, a local farm store.

C&S is famous for their Friday night cookout, where they serve burgers, corn, and fresh veggies roasted over the fire.

With none of Tim's delicious cooking at Harvard Forest and no reason to buy groceries since everyone was headed home the next day, a few of us went to chow down on locally-produced beef and delicious grilled veggies.

The evening ended with eating fresh homemade ice cream, feeding the cows, and playing on the swings. It was a low key event - a wonderful and relaxing way to spend our final Friday night together.

Thursday, August 12, 2010
REUs Ace Summer Symposium!
By Aleta Wiley
In the final week of the Summer Research Program in Ecology for Undergraduates at Harvard Forest, all 33 students participated in the Student Symposium on August 11-12 in the Fisher Museum. Over a day and a half, all the students presented 15 minute talks to an audience comprising program mentors, university professors, Harvard Forest researchers, family members, and of course, their fellow students.
As each student discussed his/her summer research, the audience was impressed with the diversity of projects presented (Abstracts are available here). Since Harvard Forest is an LTER (Long Term Ecological Research) site, several students had continued large-scale research projects that have been operating for several years. Two students collected and analyzed data from the Hurricane Plot, an area of experimental forest that sustained a “simulated hurricane” 20 years ago in order for researchers to learn more about the effects of wind disturbance on the land. Other students conducted research on the “soil warming” plots designed to learn how climate change might affect the environment. Two other students monitored woodpecker nests in suburban and natural environments, continuing observations that have been made for 5-6 years.


Not all projects this summer had been long-running, however. Several students helped with experiments that were in their first year, but that are expected to continue long into the future. These students learned a lot about the value of collecting baseline data so that future researchers will be able to detect changes in their plots.

Still other projects addressed more computational and technological advances in the field of ecology. One student used GIS to study distribution of an invasive species; others placed cameras on forest towers to detect changes in phenology, and another student developed models and simulations to learn about climate change.


Two students represented the social sciences and presented results from a survey distributed to 1,000 landowners in Vermont and New Hampshire. And, another student produced a documentary film about paleoecology, which, among other uses, will be incorporated into the Harvard Forest Schoolyard Ecology program, where local schoolteachers introduce ecology research in their classrooms. (Watch the video on YouTube here: "Secrets of the Mud: A Hemlock Mystery".)
As the Symposium concluded on Thursday afternoon, the students released cheers of excitement as they recognized how much work they had accomplished over the summer and how their time together was quickly approaching an end. A celebratory barbeque was prepared by our ever-hardworking cooks, and the Summer Program came to a close over a beautiful New England evening.
Tuesday, August 10, 2010
Harvard Forest Get-Together at the ESA Annual Meeting
By Aleta Wiley
This year, Harvard Forest organized a social event at the Annual Meeting of the Ecological Society of America in Pittsburgh, PA. The goals of the social were to bring together past and current folks who have worked at the Forest to catch up with each other and to provide an occasion for any undergraduates attending the ESA Meeting to come learn about opportunities at the Forest.
On August 3, 17 people attended the social at Olive or Twist, a martini bar close to the Convention Center in Pittsburgh. 7 past REU students, 5 past researchers, 4 current researchers, and 1 potential future REU student were able to connect with each other, chat about current projects at the Forest, and learn about how Harvard Forest has influenced their lives and career paths. It was great to learn that several REU alumni have attended or are now enrolled in graduate ecology programs around the country!
Thanks to everyone who attended this event – we’ll hope to see more Harvard Forest alumni in the future!

[Morgan Tingley (REU '00 & '01), Sarah Butler (current researcher and mentor for REU program), and Jen Johnson (past research assistant) chatted about current projects at the Forest]

[Marit Wilkerson and Jens Stevens, both REU Alumni from '05, caught up with each other while discussing the benefits of the Harvard Forest program with Ava Hoffman, an undergraduate at the University of Virginia.]

[Naomi Clark and Matt Lau, both REU alumni from '03, were excited to re-connect at this event]
RESEARCH PROFILE: Using Models to Project How Climate Change Might Affect Oak Species Distribution
By Elisabete (Baker) Vail
Imagine if crystal balls which allowed us to catch a glimpse of the future, actually existed? What would you use them to see?
Well, in a way – they do exist. In the abstract world of math and computers, “models” are fed datasets of current day information and asked to project future outcomes. Ecologists use them to forecast how current events will shape our future planet. This is what I have spent my summer, attempting to do.

My project attempts to project the possible affects that increasing climate change may have on oak species distribution. Focusing on 27 oak species, located across the eastern United States – I am using information collected for over 81,000 sites from both current day Global climate models and future emission scenarios to predict what the region may look like in the year 2050.
In order to do this, I spent the majority of the summer using an open-source (free) programming language called R to write dozens of computer programs, which allowed me to organize this collection of information into three datasets – present day, future emission scenario 1 and future emission scenario 2. These datasets, which basically look like giant excel sheets, are divided into rows representing site locations described by latitude longitude (over 81,000 rows) and columns representing presence absence data for each of the 27 oak species and relevant environment variables for the given location. In the future emission scenarios datasets, the presence absence data was omitted, because this is exactly what we are trying to project.
I then analyzed the initial present day data using a statistical model, creating 27 new sub-datasets containing presence absence data for a given oak species and the top 5 environmental variables most relevant to that species survival.
These new datasets, along with both of the future emission scenarios were fed into an ensemble suite of 9 separate statistical computer models. Maps were produced from these models, for the eastern United States, showing both current and predicted presence absence data for a given oak species.
This was an amazing project to be part of. In the last few months, I have learned a great deal about the concepts of computer models and the extreme importance of validating the accuracy of our data. I have also fallen in love with programming and developed a strong sense of confidence in not only my abilities as a computer programmer, but also in the role that my skills can play in current day science.
My project was really just a small part of a much larger goal, which will continue on without me. In the future, my work will be used as a reference against a new improved statistical model currently being developed by my mentors. I’m sad to leave Harvard Forest and the work that I have done here, but am comforted in knowing that my work will go on to become a part of “real science”. It is truly one of my greatest academic accomplishments and I am so grateful to have had this opportunity.
[Elisabete (Baker) Vail is a senior at Simmons College in Boston, Massachusetts and will complete her double major in Biology and Computer Science this December.]
Monday, August 9, 2010
RESEARCH PROFILE: Vegetation Sampling in Wildlands and Woodlands
By Maddy Case and Joe Horn
We have spent most of the summer traveling across New England to do field work at sites in Massachusetts, New Hampshire, and Maine. At each site, we have been establishing permanent vegetation sampling plots for a long-term study comparing forest dynamics in managed and unmanaged forests. We carry 2-foot pieces of steel pipe into the woods (3 lbs per pipe x 3 plots x 4 pipes per plot + 10 lbs for other gear = Wicked heavy), use them to mark the corners of 20x20 meter plots, and survey these plots for herb-layer species, saplings, trees, evidence of historical disturbance, and environmental variables. Over the course of the summer, we have gained familiarity with the flora of New England and cemented a great friendship while also learning about the logistics and challenges of independent field research.

A typical day in the field would involve sampling 1-4 plots, depending on the difficulty of access and sampling. The two sites in Maine proved the most challenging, what with fir-choked stands and an abundance of new species to learn in Dover-Foxcroft, and long hikes through recently logged forests and vicious spruces in Amherst. In all, we sampled about 60 plots this summer (roughly 6 acres of forest in total!). On the rare days when it rained, we rejoiced and worked on data entry and identifying unknown species.

Since returning from our last field excursion, we have spent the last two weeks of the program focusing on our individual projects for the symposium. Maddy is analyzing the data from the past three years of W&W vegetation sampling to study the effect of overstory composition and environmental variables on understory diversity. Joe is working on improving data management and creating a master species list for the project. After spending half the summer camping, cooking for ourselves, and regularly confronting insects and humidity, we are enjoying our beds, Tim's cooking, and the chance to work inside unperturbed by the weather.


Wednesday, August 4, 2010
PROJECT PROFILE: Exploring the Abiotic and Biotic Drivers of Soil Respiration on the Harvard Forest Prospect Hill Tract
By Claudia Reveles, Joanna Blaszczak, and Maya Thomas
Our project is in the field of soil carbon dynamics, specifically looking at the rate of carbon dioxide efflux around Prospect Hill as well as areas that have been manipulated by different abiotic (nitrogen input and temperature) and biotic (adding leaf litter and removing roots) factors.

A preliminary map was generated using GIS to identify areas (polygons) in Prospect Hill with unique stand (prominent tree species) and soil drainage types. A total of 59 areas were identified, but some were excluded due specific conditions (i.e. excessively drained areas like bogs and impervious areas), leaving a total of 56 plots. The biggest polygons have three plots each. For reconnaissance, we used GIS to find the center point of each polygons on, and would place a collar down for the sampling chamber to be rested upon. We also sample at four different treatment areas: trench plots, chronic N, and soil warming (hot plants/warm ants), all located in the Prospect Hill tract, and DIRT (detritus input and removal treatments), which is located in the Tom Swamp tract. At the trench plots, a tarp was placed underneath the area and the roots were removed. At the chronic N plots, we sample six treatments, low nitrogen input, high nitrogen input, and control in both a pine and deciduous stands. The soil warming site has 30 plots with varying temperature changes. There are 21 DIRT plots, some with double leaf litter, others with the O and A soil horizons removed, and other such manipulations. We placed three collars in each DIRT plot and five collars in each chronic N plot. There is one collar in each of the soil warming plots, and three collars in the trenched plots and three collars outside of the trenched plots, which serve as the control.

We have divided tasks among our group, with Claudia dealing with gradient (Prospect Hill) efflux trends, Joanna looking at trends among the different treatments, and Maya conducting spatial analysis to look at efflux trends based on location in Prospect Hill. Soil respiration, as well as soil temperature and soil moisture, is measured every week, gradient and treatment locations alternating biweekly (a total of 10 weeks of sampling, 5 weeks of gradient and 5 weeks of treatment). We use the LiCor 6400 photosynthesis analyzer machine to measure soil temperature and soil respiration, and the HydroSense probe to measure soil moisture. Sampling usually takes only 1-3 days out of the week, so the rest of the week we usually work on our individual tasks, organizing data, running statistical tests, and inputting and analyzing data in GIS. Currently, we have augered samples at each of the gradient locations (organic and mineral layers) and are now processing the soils in the lab for root density, bulk density, and carbon and nitrogen content. We also plan on gathering the leaf area index at each of the gradient plots in the last few weeks to see how biomass affects soil respiration.

While we are still gathering and analyzing our data, we have learned many things about forest ecology and how different variables would affect soil respiration. For instance, we have learned that warm and wet conditions would cause an increase in carbon dioxide efflux, and that microbial (decomposition) activity is higher in the morning and also in the trenched areas (since there is significantly less root respiration).
Our project is in the field of soil carbon dynamics, specifically looking at the rate of carbon dioxide efflux around Prospect Hill as well as areas that have been manipulated by different abiotic (nitrogen input and temperature) and biotic (adding leaf litter and removing roots) factors.

A preliminary map was generated using GIS to identify areas (polygons) in Prospect Hill with unique stand (prominent tree species) and soil drainage types. A total of 59 areas were identified, but some were excluded due specific conditions (i.e. excessively drained areas like bogs and impervious areas), leaving a total of 56 plots. The biggest polygons have three plots each. For reconnaissance, we used GIS to find the center point of each polygons on, and would place a collar down for the sampling chamber to be rested upon. We also sample at four different treatment areas: trench plots, chronic N, and soil warming (hot plants/warm ants), all located in the Prospect Hill tract, and DIRT (detritus input and removal treatments), which is located in the Tom Swamp tract. At the trench plots, a tarp was placed underneath the area and the roots were removed. At the chronic N plots, we sample six treatments, low nitrogen input, high nitrogen input, and control in both a pine and deciduous stands. The soil warming site has 30 plots with varying temperature changes. There are 21 DIRT plots, some with double leaf litter, others with the O and A soil horizons removed, and other such manipulations. We placed three collars in each DIRT plot and five collars in each chronic N plot. There is one collar in each of the soil warming plots, and three collars in the trenched plots and three collars outside of the trenched plots, which serve as the control.
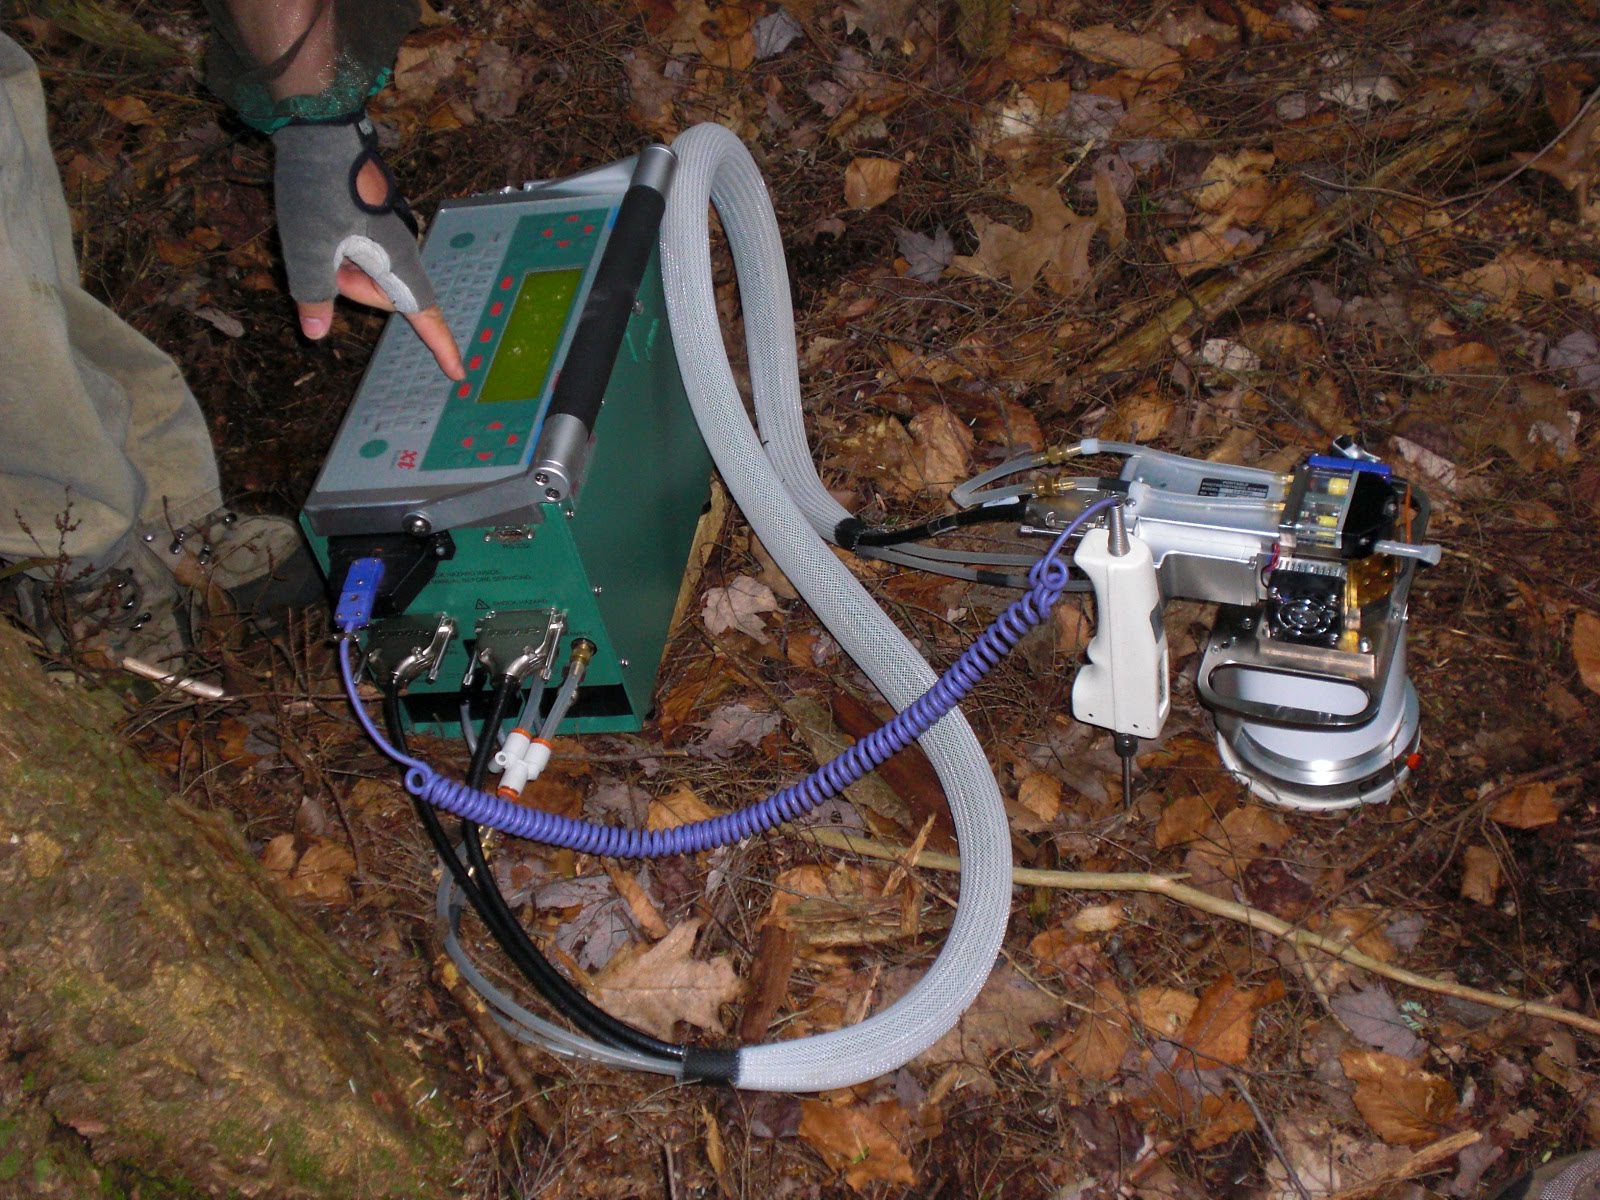
We have divided tasks among our group, with Claudia dealing with gradient (Prospect Hill) efflux trends, Joanna looking at trends among the different treatments, and Maya conducting spatial analysis to look at efflux trends based on location in Prospect Hill. Soil respiration, as well as soil temperature and soil moisture, is measured every week, gradient and treatment locations alternating biweekly (a total of 10 weeks of sampling, 5 weeks of gradient and 5 weeks of treatment). We use the LiCor 6400 photosynthesis analyzer machine to measure soil temperature and soil respiration, and the HydroSense probe to measure soil moisture. Sampling usually takes only 1-3 days out of the week, so the rest of the week we usually work on our individual tasks, organizing data, running statistical tests, and inputting and analyzing data in GIS. Currently, we have augered samples at each of the gradient locations (organic and mineral layers) and are now processing the soils in the lab for root density, bulk density, and carbon and nitrogen content. We also plan on gathering the leaf area index at each of the gradient plots in the last few weeks to see how biomass affects soil respiration.

While we are still gathering and analyzing our data, we have learned many things about forest ecology and how different variables would affect soil respiration. For instance, we have learned that warm and wet conditions would cause an increase in carbon dioxide efflux, and that microbial (decomposition) activity is higher in the morning and also in the trenched areas (since there is significantly less root respiration).
Tuesday, August 3, 2010
PROJECT PROFILE: Using Computer Science at Harvard Forest to Increase Integrity of Scientific Conclusions
By Sofiya Taskova and Morgan Vigil
This summer, we have had the privilege of working with Dr. Emery Boose and Dr. Barbara Lerner on a project involving a mash up of ecology and technology. For the past few weeks, we have been inundated with the buzzwords "data provenance", "sensor network", "Process Derivation Graphs", "Data Derivation Graphs", "stream discharge", and "weirs". Our headquarters is located in the Shaler Common room (where we do most of our programming and computer work), but we do make a weekly trip out to the six hydrology sites in the forest to collect manual and logged data as well as water samples and measurements for stream ecologist Dr. Henry Wilson of Yale University.

Our work addresses the problem of data provenance--which handles how data is collected and processed, who interacts with the data, what is added to the data, where data originates, when data is collected, and similar questions. More and more, we are using electronic sensors to collect data, which allow for massive data accumulation. However, this huge amount of data comes with a price--sensor drift, sensor failure, logger failure, server failures, and other "technical difficulties". By making data and everything that affects it transparent, data provenance gives integrity to the scientific conclusions drawn from digital data.
 Currently, Morgan is working with Little-JIL--a visual programming language that allows informative "metadata" to be captured while raw sensor data is processed into a more usable format. She is focusing on making the process more usable for non-programmers (specifically stream ecologists) by adding a graphical user interface to the process with a setup wizard. She has also revised and built upon the existing Little-JIL process so that more provenance data about input files and .properties files used in the process can be passed on to a DDG.
On a day to day basis, she is programming (mainly working in Java) but also collects water samples and digital data from the hydro sensors in the forest once a week.
So far, she has learned a lot about the software design process, especially with regards to collaborating with scientists from a different field. She has also learned about the importance of creating data management protocol for the sake of reproducibility and reliability.
From here, there are many ways to go with Morgan's side of the project. She would like to see the process abstracted so that a scientist could use it to collect provenance data from any kind of sensor. She would also like to see it be connected to a DDG-creating process. It would also be good to see it developed into an even more usable tool for scientists.

Sofiya is using a graph (a structure that describes relations between the elements - procedures and data instances - that constitute the process) to represent the specific process that a piece of data undergoes. Her goal is to optimally represent the different manipulations of the data and to collect the provenance information of a running process.
The central question that she is addressing is what amount of information to collect about a process. It appears preferable to maximize the details in order to avoid undermining any software functionality that could be of interest. However, massive data sets are very likely to be manipulated in practice, in which case, the amount of provenance information explodes.
On a day-to-day basis, she works on a computer program that collects information on a process strictly defined in the graphical language Little-JIL. She also describes traversals of Process Derivation Graphs (graphs showing all possible execution paths) using Data Derivation Graphs (graphs showing execution paths of particular pieces of data) to help consider the possible handlings of the data and errors that may occur during the process.
While working on the project, she has become familiar with the problem in scientific research of keeping data measurements consistent and adequate for analysis and comparison despite the variation of scientific methods and the myriad of circumstances that may flaw the validity of the data.
In the future, Sofiya is looking to continue working on the software for collecting, storing, and using data provenance information. She is hoping that the basic functionality supported by the software will solve the problem of data provenance in strictly defined processes in many domains including science, engineering, and health care.

Monday, August 2, 2010
STUDENT HIGHLIGHT: The Delicious Food for the Harvard Forest Summer Program
By Sarah Gray
When I arrived at Harvard Forest back in May, I was shy, timid, and scared of my new environment. After meeting some of my fellow REUs, I became more relaxed with my surroundings. After the jitters of my first day subsided (having arrived at the Forest a week after the other students), I realized that I was starving! I asked my housemates if there was any food, and their reply was "Ohh, yes. There is food."
Joe Horn, a fellow REU, led me into the kitchen and told me,"You know the old saying: ‘Never trust skinny cooks?’ Well, here at Harvard Forest, that is not the case." After eating one bite of the cold stir-fry straight from the fridge, I agreed. Since then, I would not only trust Tim and Sarah with my stomach, but my life.

There has never been a meal that was not completely delicious. From the vegetables that are cooked to perfection to the deserts that make you go for fourths, I can't seem to stop eating. When I was younger I always used to joke about the food I wanted served to me when I was on my death bed, and Tim's and Sarah's food makes that cut. One of my favorites were the tacos made with local beef and the perfect spices; the chocolate almond cherry cookies certainly win an honorable mention.

The things I think that have made me gorge and drool were the Strawberry Shortcake Cake and the Triple Chocolate Mousse. My friends here can attest that, on the night of the Triple Chocolate Mousse, I ate about four of them and still wanted more.
Now that the end of the summer program is nearing, I am counting down the final days of eating this delectable food before it is back to Mac & Cheese and PB & J. I will miss Friday morning breakfasts of waffles, blueberry pancakes, and mouthwatering coffee cakes and sticky buns.

So this is a shout out to the cooks, and a huge thanks for keeping our tummies full and happy.
Friday, July 30, 2010
PROJECT PROFILE: Using GIS to model how climate change and land use will affect the abundance of common ragweed
By Israel Marquez
The big picture of the project I am working in is to model how climate change and difference in land use will affect the allergenic potency of Artemisia artemissifolia, better known as common ragweed. This is the first year of a four-year study, so creating a database that will work for the rest of the project is indispensable. I am working on developing part of a geodatabase containing a myriad of GIS shape files, from “all roads” layers to layers containing parcel owner information and population densities.
Using GIS, my team has created a layer that combines three different land cover categories (Forest, Open and Developed) with three different averaged temperatures. This combination gives us nine categories (E.g. Open, Low Temperature). We have up to 10 plots created randomly in each category, and I have created maps that facilitate us access to our plots by collecting detailed information such as addresses and land use. We have surveyed most of our plots in Massachusetts, New York, Connecticut, and New Jersey, and we expect to go to Vermont and New Hampshire in the next few weeks.

Once we are at our plots, we also look for factors, other than temperature and land cover, that might affect ragweed distribution at a finer scale. For example, we’ve been in plots under the same category, but completely different land uses. One might be a baseball field and the other an agricultural field. Or even if both are agricultural fields, plowing practices and distance to right-of-ways might affect ragweed population per plot, so we have to be careful when collecting data to pay attention to those details.
Building a bridge between environmental and social factors is essential to understand how ragweed will affect human populations in the future, and that is exactly what I am trying to do. With the collected data, I am going to do a spatial distribution model showing ragweed abundance using the characteristics mentioned before as parameters, and linking them to socio-economic variables and human population density.
Thursday, July 29, 2010
Seminar: Good Scientific Presentation Skills
By Aleta Wiley
Two weeks from now, all 33 summer REU students will be speaking in a two-day Symposium at Harvard Forest. They will have 15 minutes to discuss their research projects from this summer. For some, this will be their first public presentation.

In preparation for their talks, David Orwig, Senior Ecologist at Harvard Forest, gave a seminar Tuesday night, “How to Give a Good Scientific Presentation”. Orwig discussed how the framework for a scientific presentation should parallel the structure for a scientific paper by including sections on objectives, methods, results, discussion, and conclusions. He emphasized to students to think about which 2-3 main points they want their audience to remember, and to make sure those points are made clearly throughout the talk. He provided several useful tips, such as:
- Acknowledge co-authors in your opening remarks
- State your objectives clearly and concisely
- When describing methods, be precise but not exhaustive. Include maps of study locations, photos of your research site, study organism, and equipment used, but don’t go into every detail of how you collected and analyzed data.
- When displaying a graph of results, make sure to explain the components of the graph. Tell the audience what the axes are, which colors or bars represent which data, and why you drew certain results from the graph.
- Use tables and graphics that only have information you want the audience to see. Statements like “I know this is hard to read, but I really just want to point out this section” are frustrating to an audience. Edit your tables and graphics to have only the sections you want to discuss.
- In your discussion and conclusion, remember to emphasize the 2-3 main points you want your audience to remember. A conclusion should be quick; it is your last opportunity to reinforce your main idea.
- Include an acknowledgment slide at the end of your talk to identify key personnel and funders.
In addition to discussing how students should structure their presentations, he also provided several good tips on presentation skills:
- When speaking, be enthusiastic and smile!
- Do not read your slides verbatim; talk with your audience, not to the screen.
- Practice transitions between sections and slides
- Create slides that are simple and easy to read. Use consistence colors and backgrounds.
- Try to make “color-blind-friendly” slides by not mixing reds and greens in figures (use this for assistance)
- Practice your talk; finish on time; tailor your talk to your audience.
The bottom line for a good scientific presentation? Be organized, speak clearly, and be enthusiastic! If your audience remembers your 2-3 main take-home points, your talk has been a success!
Tuesday, July 27, 2010
PROJECT PROFILE: Soil Warming and Hardwoods
By Sarah Gray
 Here at the Harvard Forest, I am working on the effects of soil warming on various hardwoods. There has already been an experiment to test the effects of global warming on soil. The 20-year-long experiment found that with increased soil temperatures there was an increase in microbial activity. This increase in microbial activity led to more usable nitrogen in the system. Nitrogen is the limiting nutrient in tree growth; with more nitrate and ammonium availability, trees can continue to grow. Ammonium can easily be made into many amino acids, proteins, which the tree can use. However, nitrate, the other form of nitrogen, cannot be used to make proteins. Nitrate needs to be broken down into ammonium. Trees make this enzyme, called nitrate reductase, which reduces nitrate to ammonium. My project this summer is measuring the amount of nitrate reductase enzymes in Oak, Sugar Maple, Red Maple, and Birch. My mentors and I measure trees at Barre Woods where there are two twenty meter plots, one heated and one controlled. This summer we started measuring trees grown with different fertilizer treatments in the greenhouse. We measured both the roots and the leaves to compare nitrate reductase activity.
 On a day-to-day basis, my activities vary between working in the lab to working in the field. It is the perfect mix for me since I am majoring in chemistry, but plants are my passion. In the lab, I measure the amount of nitrate reductase by using an indicator and a spectrophotometer. Out in the field, I collect samples and take soil cores. In the greenhouse, I fertilize, water, and deal with pests. In the beginning I did a lot of reading to formulate a protocol for testing roots since it had never been done before in the experiment.
The project is in its second year of testing. In future years they will continue to test nitrate reductase activity to see if there is any pattern between species or the different plots. There might be a competitive advantage among species if the tree is capable of using nitrate. For the rest of the summer, I will be analyzing the various data I have collected to see if there is any correlation.

Monday, July 26, 2010
PROJECT PROFILE: Tracking Moose and Deer
By Carlyn Perovich and Mickey Drott
We have spent the summer happily crawling around in the forest, bruising ourselves under mountain laurel in pursuit of the holy Grail of our project, moose poop. We are studying the impact of deer and moose browsing on the regeneration of forests, specifically looking at hemlock and oak seedlings. This research is particularly important since the number of white tailed deer continues to increase, and moose recently reappeared in Massachusetts after being extirpated since the mid-19th century.

All the same, you don't have to be very knowledgeable about forest life to know that moose don't fit under mountain laurel, so why would we look under those plants? We have been hiking, rain or shine, out into the wilderness to set up plots on points in state-owned lands that are randomly generated by a computer. This often means that our points are in the least convenient places possible, under mountain laurel, on mountain tops, or at the ends of roads that have restricted access because they are associated with a local jail. Once we have managed to get to a site, we establish 20x20 plots in which we look for deer and moose signs. We also take note of the trees and shrubs in order to gain some understanding of the prevalence of deer and moose at a location and their impact on the forest composition.
This data collection is part of a larger project that also incorporates exclosure plots. The exclosure plots are set up in a recent clear cut and consist of a full exclosure (keeps both deer and moose out using fences), a partial exclosure (keeps moose out but allows deer to crawl in through a two foot gap along the bottom of the fence), and a control where there are no fences.

Mickey is interested in the impact of these clear cuts on the level of deer and moose browsing activity not only within the clear cut, but also in the surrounding area. It is known that a larger number of young trees and shrubs growing up in the recently cut plots provide a greater amount of food in a small area, thus attracting a greater concentration of ungulates. He hopes to identify the impact of the clear cut on the surrounding area, seeing how far into the forest the effect of the clear cut can be seen on browsing levels.
Carlyn's individual project is focused on oak regeneration. She'll be looking at oak regeneration in response to all the variables we measure at the plots (overstory characteristics, shrub cover, soil, deer and moose sign, red maple browse index, and physical characteristics of the site). She is also going to use existing GIS data to examine patterns in oak regeneration from a broader land use perspective, taking into consideration ecoregions, habitat fragmentation, and proximity to clearcuts and development.
Tuesday, July 20, 2010
Helping the Wood Turtles and Learning About Passion: REU Students Participate in Annual Service and Career Day
By Aleta Wiley
Last week, all 33 REU students got to take a day off from their regular research projects in order to participate in Service and Career Day, an annual event held each summer for the Program.

For 4 hours in the morning, the students worked for The Trustees of Reservations (TToR), a land trust established in 1891. On the Brooks Woodland Preserve, just a few miles from Harvard Forest, TToR is restoring habitat to be suitable for wood turtles, a threatened species. The turtles need to be able to travel between a small creek in the woods and a newly-created opening in the forest where they will lay their eggs. However, significant amounts of woody debris (such as fallen limbs and branches) accumulated on the ground when the meadow was restored. The REU students were tasked with moving this debris so that it would not prevent the wood turtles from arriving at their mating sites. “We’re building a turtle highway to turtle sex heaven!”, as one student summarized.
“Think like a turtle. Get on your hands and knees, if you like, to try to see what might be a barrier for a wood turtle along this corridor,” Walker Korby, North Quabbin Superintendent of TToR, told the students.

After a few hours of moving fallen limbs and raking down piles of dirt, Korby led the students through an interesting exercise in using peripheral vision. The students all formed a circle, shoulder-to-shoulder, and then practiced using their peripheral vision by focusing on their hands, which they held out to the sides of their faces. Once used to focusing sideways, the students tried to throw a ball to each other, across the circle. The exercise taught the students how they actually can see much more of their surroundings using this type of vision, rather than our instinctive mode facing forward.

The purpose of this restoration project took some time for the students to understand. They learned about land restoration and discussed different philosophies on conservation and wilderness protection while working on this service project. In the end, most students felt like they had contributed to the goals of TToR, and all were grateful to spend the day with their friends in the sun.

“Service Day introduced me to a local land trust that I didn't know very much about before, and let us explore beautiful, local, preserved woodland that I don't think any of us knew existed.” – Megan Jones
"Service day really taught me the meaning of friendship. I really enjoyed working together with the other REU students. Although our work was not the most exciting, working side by side with other students who share my passion was." – Kristen Schipper
“For service day, we were supposed to scatter piles of broken branches to make it easier for wood turtles to cross the woods from the pond towards the clearing. It became an interesting and fun exercise for us to figure out how it would be easiest from a wood turtle's perspective to navigate the debris. Another exercise we did was using our peripheral vision to determine the extent of our visual ranges. Using this vision, we practiced throwing balls and trying to catch them without following them with our eyes (i.e. using peripheral vision).” – Sarah Fouzia Choudhury

In the afternoon, the students participated in Career Day. Five panelists came to Harvard Forest to discuss their personal careers and the paths they had taken throughout their lives to get to where they are today. The speakers included Betsy Colburn (Aquatic Ecologist at Harvard Forest), Stephen DeStefano (USGS MA Cooperative Fish and Wildlife Research Unit & University of Massachusetts), Elizabeth Farnsworth (New England Wildflower Society), Wayne Petersen (Massachusetts Audubon), and David Graham Wolf (Mt. Grace Land Trust).
The speakers first spent about an hour introducing themselves to the REU group. All speakers discussed the importance of passion and finding jobs and careers which you enjoy. Many of the speakers had taken circuitous career paths to their current jobs and spoke about how, even though they had times in their lives of uncertainty, job opportunities always had a way of arising at the right time. The students then broke into five smaller groups and each had a chance to talk in depth with each of the five speakers.
Almost all of the students found Career Day to be immensely valuable, in large part because the speakers demonstrated how “choosing a career” does not mean having to choose one interest and to relinquish the rest. People find ways to be artists, writers, lawyers, teachers, and businessman, and still have careers working in ecology, conservation, and the natural resources.

“The speakers at Career Day were striking examples of how attached people can become to the New England landscape, and how this attachment to place can shape a person's future l also learned more about the work done by land trusts, and about the different way research and advocacy can be integrated.” – Megan Jones
"Each of the speakers at career day provided us with enlightening and interesting information about careers in the ecology and natural resources fields. The most important thing I took away from career day is that it is okay to blend your interests for future endeavors, even if they seem quite different, such as art and science or business and ecology. I greatly value the knowledge and information I took away from career day at Harvard Forest." – Autumn Amici
“It was most gratifying to see so many bright young faces potentially interested in the biological and environmental sciences, all willing to spend a hot summer afternoon listening to others talk about their own experiences and careers. I felt that the attention and enthusiasm exhibited by the students, as well as by my fellow colleagues on the panel, was exemplary and I was very pleased to have been part of such a distinguished group. I hope everyone else profited from the experience as much I did!” – Wayne Petersen, Director, Massachusetts Important Bird Areas (IBA) Program, Massachusetts Audubon
Monday, July 19, 2010
PROJECT PROFILE: Linking Phenology to Ecosystem Processes in Forests of the Northeast
By Andrea Garcia, Adam Young, and Cory Teshera-Sterne

We are working with Dr. Andrew Richardson and two of his postdocs, Koen Hufkins and Oliver Sonnentag, to investigate ways of monitoring and measuring the phenology (recurring life cycle events, such as flowering, spring green-up or senescence) of North American forests using webcams and digital imaging. This project is highly analytical and employs the use of computer programming languages such as R and MatLab. These programs let us process thousands of images so we can isolate ideal conditions in which to measure the vegetation indices for a given day or season. There are a multitude of variables that can confound our results such as individual camera settings, weather conditions, and positioning of camera. This work is part of a larger effort involving a national phenological observation webcam network, Phenocam, which includes webcams at National Parks, research sites, and other locations around the country.
 Adam and Andrea are involved with writing computer code (mainly in R) that generates graphical output, downloading images from different sites all over the country, filtering these images and classifying them by weather conditions (clear, overcast, snow, etc.). So far a dozen sites have been analyzed in some way or another for a variety of vegetation indices and time series plots have been generated. Adam and Andrea, having little programming experience coming into the program, have “enjoyed” a steep learning curve when it comes to computer programming. So it is fair to say that they have learned quite a bit.
 Cory, probably the most tech-savvy of the group, spent most of the beginning of the summer configuring cameras, some of which are essentially small, programmable computers. Currently, Cory is working on expanding the Phenocam website, which shows only current images, to display relevant data including current time series of phenological activity both from images collected at the site and satellite data. This will allow researchers to more easily compare phenological data collected via various methods, one of the main goals of our research.
 One of our more interesting projects this summer was the installation of 14 webcams at the top of the EMS tower. We set up these cameras as an experiment to compare and contrast how different cameras influence measure the phenological response that are ultimately extracted from the collected image files. The cameras range from sophisticated surveillance systems to game cameras used by hunters. We assisted our postdoc mentors, Koen and Oliver, with building a weather-proof box (“Mr. Mad Scientist Box”) to contain a power source and data logger and with installing the cameras on top of the tower. This required carrying a 10’ board up the narrow tower, along with all the cameras and tools. It ended up being three long days of work, but was a great chance to see how the cameras all over the country that we are using data from are set up and all the hard work that goes into this research.

On a day to day basis we are glued to our computers programming, downloading and isolating images, researching phenology, conducting image analysis, and taking regular tea/coffee/hot cocoa breaks. We do get out of the office occasionally to help researchers doing related field work or to check up on our newly set up row of cameras and "Mr. Mad Scientist Box."

There is still more work to be done with images we have downloaded and all the information they encompass, but we are aware that we are working on a new and unique project in the field of ecology. This adds to our enthusiasm for working at Harvard Forest this summer.

We are working with Dr. Andrew Richardson and two of his postdocs, Koen Hufkins and Oliver Sonnentag, to investigate ways of monitoring and measuring the phenology (recurring life cycle events, such as flowering, spring green-up or senescence) of North American forests using webcams and digital imaging. This project is highly analytical and employs the use of computer programming languages such as R and MatLab. These programs let us process thousands of images so we can isolate ideal conditions in which to measure the vegetation indices for a given day or season. There are a multitude of variables that can confound our results such as individual camera settings, weather conditions, and positioning of camera. This work is part of a larger effort involving a national phenological observation webcam network, Phenocam, which includes webcams at National Parks, research sites, and other locations around the country.
 Adam and Andrea are involved with writing computer code (mainly in R) that generates graphical output, downloading images from different sites all over the country, filtering these images and classifying them by weather conditions (clear, overcast, snow, etc.). So far a dozen sites have been analyzed in some way or another for a variety of vegetation indices and time series plots have been generated. Adam and Andrea, having little programming experience coming into the program, have “enjoyed” a steep learning curve when it comes to computer programming. So it is fair to say that they have learned quite a bit.
 Cory, probably the most tech-savvy of the group, spent most of the beginning of the summer configuring cameras, some of which are essentially small, programmable computers. Currently, Cory is working on expanding the Phenocam website, which shows only current images, to display relevant data including current time series of phenological activity both from images collected at the site and satellite data. This will allow researchers to more easily compare phenological data collected via various methods, one of the main goals of our research.
 One of our more interesting projects this summer was the installation of 14 webcams at the top of the EMS tower. We set up these cameras as an experiment to compare and contrast how different cameras influence measure the phenological response that are ultimately extracted from the collected image files. The cameras range from sophisticated surveillance systems to game cameras used by hunters. We assisted our postdoc mentors, Koen and Oliver, with building a weather-proof box (“Mr. Mad Scientist Box”) to contain a power source and data logger and with installing the cameras on top of the tower. This required carrying a 10’ board up the narrow tower, along with all the cameras and tools. It ended up being three long days of work, but was a great chance to see how the cameras all over the country that we are using data from are set up and all the hard work that goes into this research.
On a day to day basis we are glued to our computers programming, downloading and isolating images, researching phenology, conducting image analysis, and taking regular tea/coffee/hot cocoa breaks. We do get out of the office occasionally to help researchers doing related field work or to check up on our newly set up row of cameras and "Mr. Mad Scientist Box."

There is still more work to be done with images we have downloaded and all the information they encompass, but we are aware that we are working on a new and unique project in the field of ecology. This adds to our enthusiasm for working at Harvard Forest this summer.
Friday, July 16, 2010
PROJECT PROFILE: The Effects of Large-Scale Deforestation
By Crystal Garcia and Angie Marshall
We are working in the clearcut up on Prospect Hill near the fire tower. Previously, this area was a spruce plantation, but 2 years ago, it was deforested and timber was harvested. This area is now used as a research site to highlight the effects of large-scale deforestation efforts. A flux-tower was set up in the middle of the area to help capture the carbon, water, and energy fluxed between the land and the air. The data we are collecting will be used to put the flux tower measurements into context to better understand the effects of climate variability on carbon sequestration and release from ecosystems (US Forest Service 2009).

To get a snapshot of the landscape, we must employ many different types of data collection methods. Throughout the summer, we’ve been measuring woody debris and vegetation. We have 5 transects that extend from the flux tower, and each transect measures 50m. We identified over 39 different types of vegetation along these transects and also recorded vegetation abundance. Fine woody debris data will also be collected along these transects. We also have 12, 20m x 20m plots between the transects (3 between each transect) where we identified and measured seedlings and saplings as well as collected all coarse woody debris measurements. So far we have completed our vegetation survey comprised of a botanical inventory, vegetation transects, and seedling and sapling plots.
Currently, we are working on finishing up collection of woody debris data so that we can resample our vegetation transects to record vegetation growth and capture any differences in vegetation composition. For our individual projects, we are both focusing on different aspects of the clearcut data we‘ve collected.

Angie will be using the woody debris data and, based on the decay rates proposed in scientific papers, will predict the rate of decay in this specific clear cut in order to better understand the rate at which carbon is released from the debris.

Crystal will perform analysis on the data gathered from the vegetation transects and seedling/sapling plots to characterize the vegetation found in the clear cut as well as its composition in the site. She will also be using Audrey Barker Plotkin’s (Harvard Forest Site Coordinator) previously collected data on the plantation before it was harvested to compare pre- and post-harvest data to record changes in vegetation inventory, growth, and composition.

It gets pretty warm in the clearcut during the summer months, but we are rewarded with an endless supply of berries and a nice farmer’s tan. All of our hard work has been well worth it and will continue to reward us well into the future. We will not only come out of this experience with data to be used for our own research endeavors at our home institutions next semester, but we’ll also have mastered valuable field methods and the opportunity to perform data analysis on data we singlehandedly collected and compiled . As a student, you aren’t always afforded the chance to play such a significant role in each phase of the scientific process, and we definitely are experiencing that here at Harvard Forest, which is extremely rewarding.
Subscribe to:
Posts (Atom)